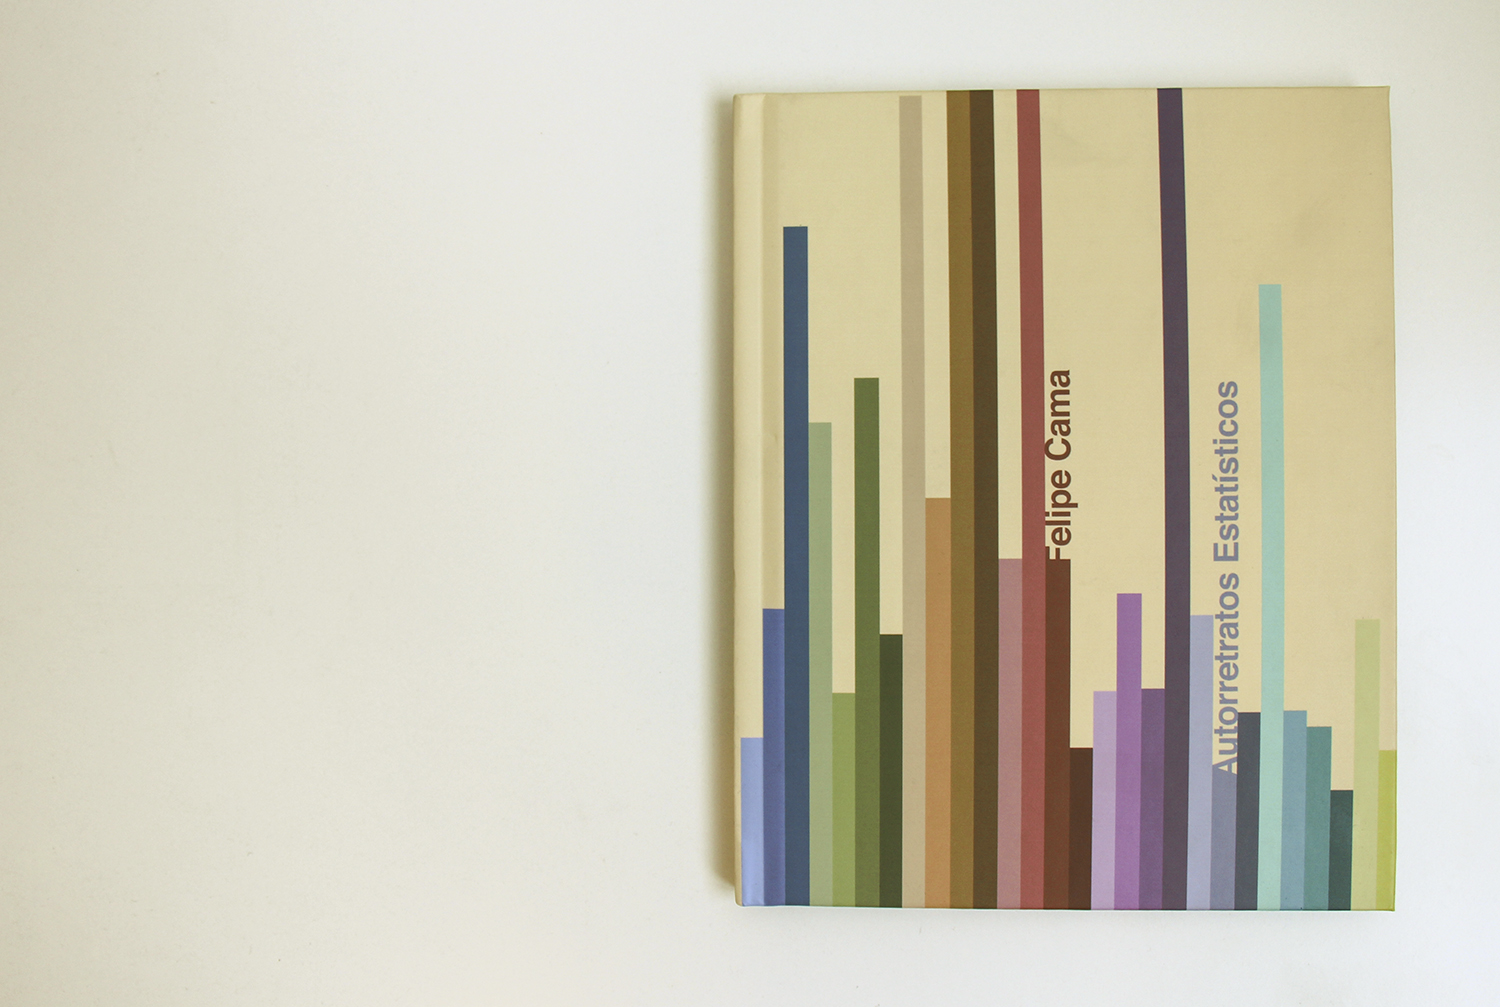
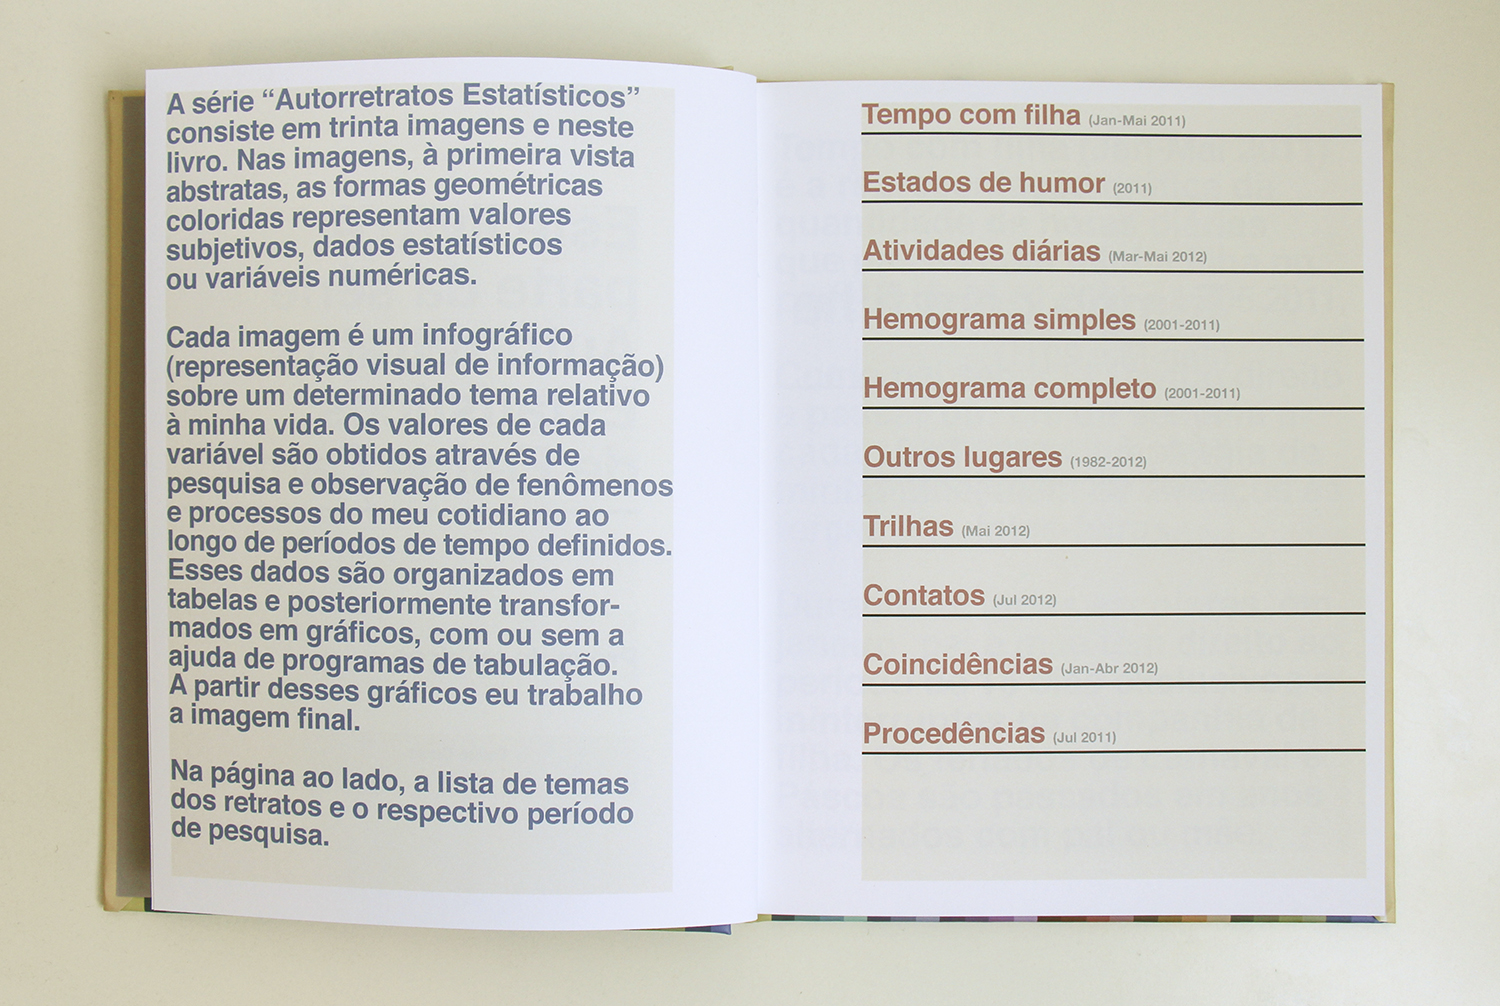
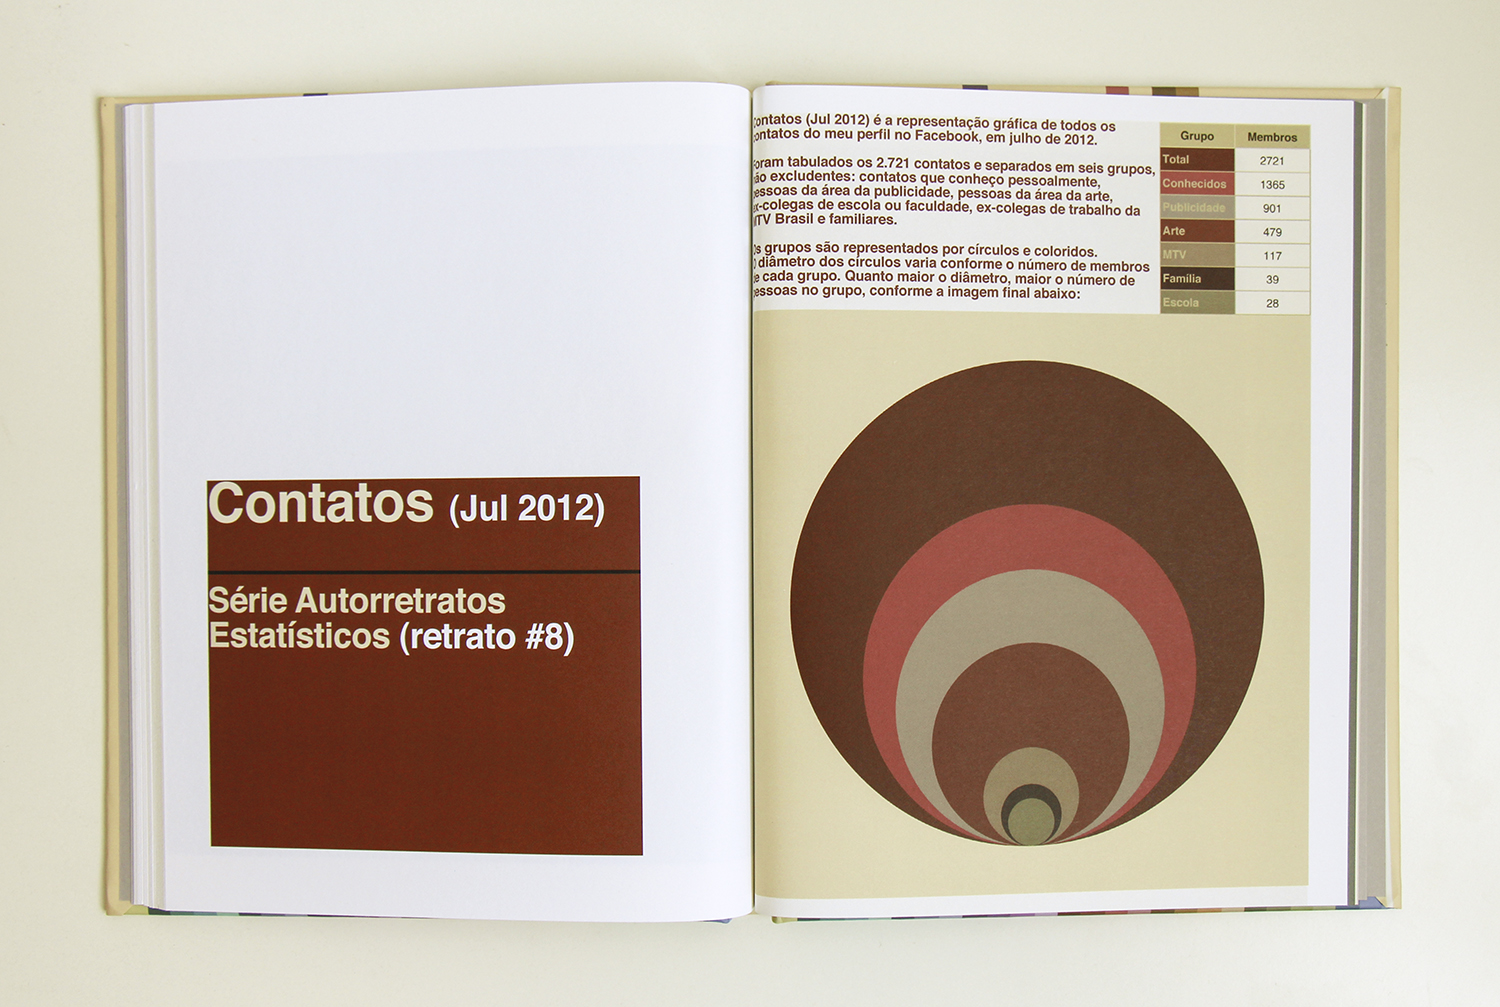
The Statistical Self-portraits Series (2012) consists of thirty images and a book. In the images, at the first glance abstract, the geometric colorful shapes represent subjective values, statistical data or numeric variables. Each image is an infographic (visual representation of information) on a given topic on the artist's life. The values of each variable are obtained through research and observation of phenomena and processes of everyday life over pre-defined time periods. These data are organized in tables and subsequently converted into charts, with or without the aid of spreadshit software. From these charts the artist creates the final image.
Mouse over the images below to view technical information, click to enlarge.
Click on the images to enlarge.


